How it works
Every picture this app draws comes from one formula and one operation.
The curve
A point in the plane is a complex number. The curve is a finite sum of rotating complex exponentials:
Each term is a point going round a circle: fk is how
many times it goes round as t completes one turn, and
ck is the radius and starting angle. Adding the terms is
the same as mounting each circle on the rim of the one before it — a chain
of arms, each spinning at its own rate. Three terms means three arms, and the
tip of the last one traces the curve.
That is the whole construction. The frequencies field holds
the fk; the coefficients field holds the
ck.
Frequencies decide the shape
The integers control how many times each arm turns, so they set the curve's lobe structure. Here is a single copy of the curve, with no rotation applied:
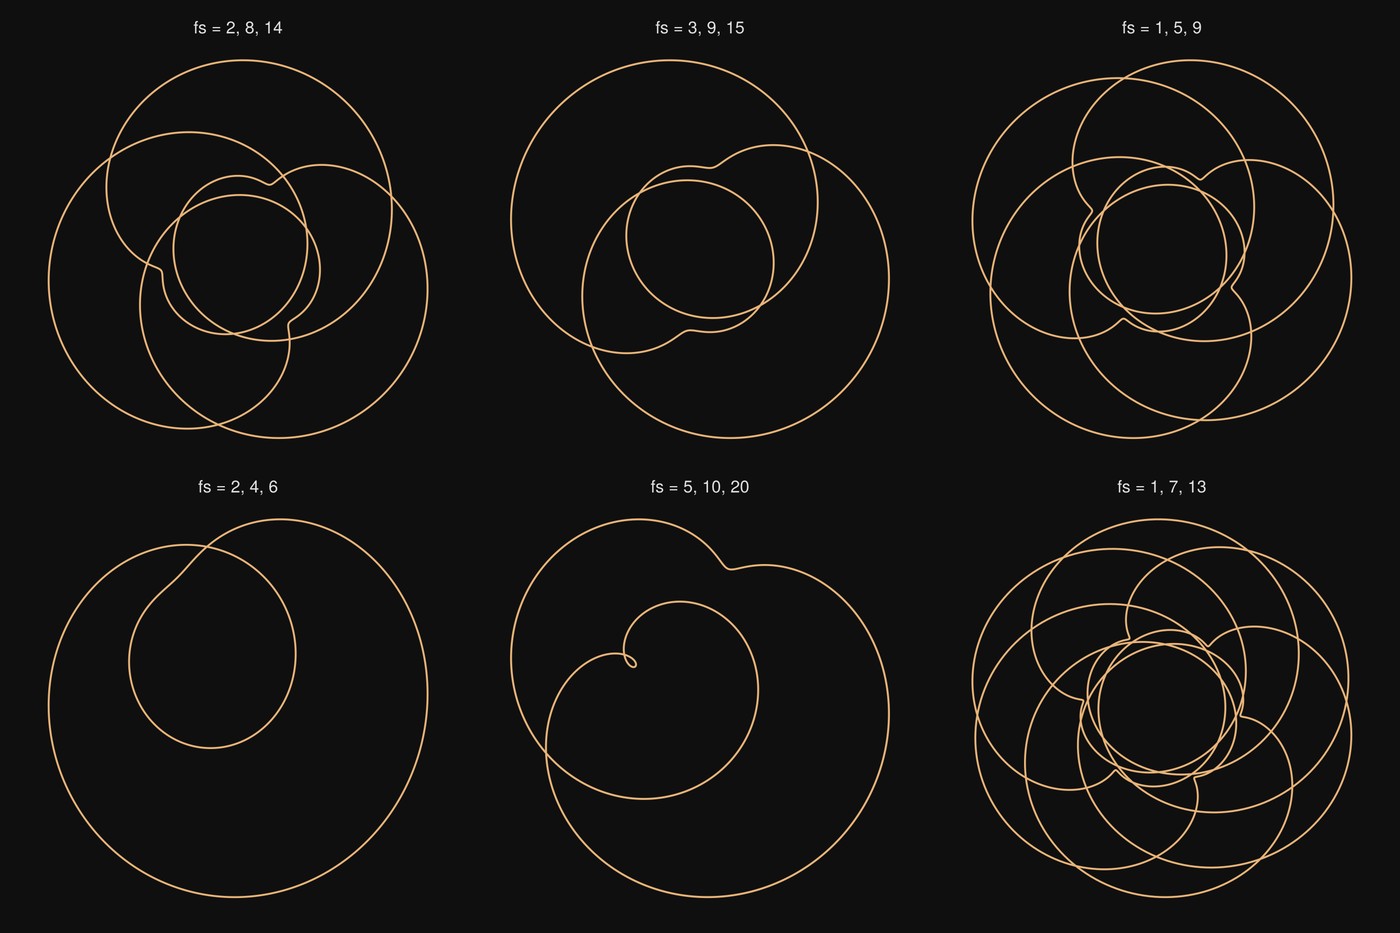
Reading them: 2, 4, 6 is nearly a plain double loop, because the
three arms turn at simple multiples and stay roughly in step. 1, 5, 9
opens into a six-lobed rosette. 1, 7, 13 is the busiest —
widely separated frequencies mean the arms rarely align, so the curve wanders
further before closing.
2, 8, 14 and 1, 7, 13 are both
spaced by 6 and produce related shapes; 2, 4, 6 is spaced by 2 and
is far simpler.
Coefficients decide the proportions
Same frequencies, different coefficients — shown at 12 rotations so the structure stays visible:
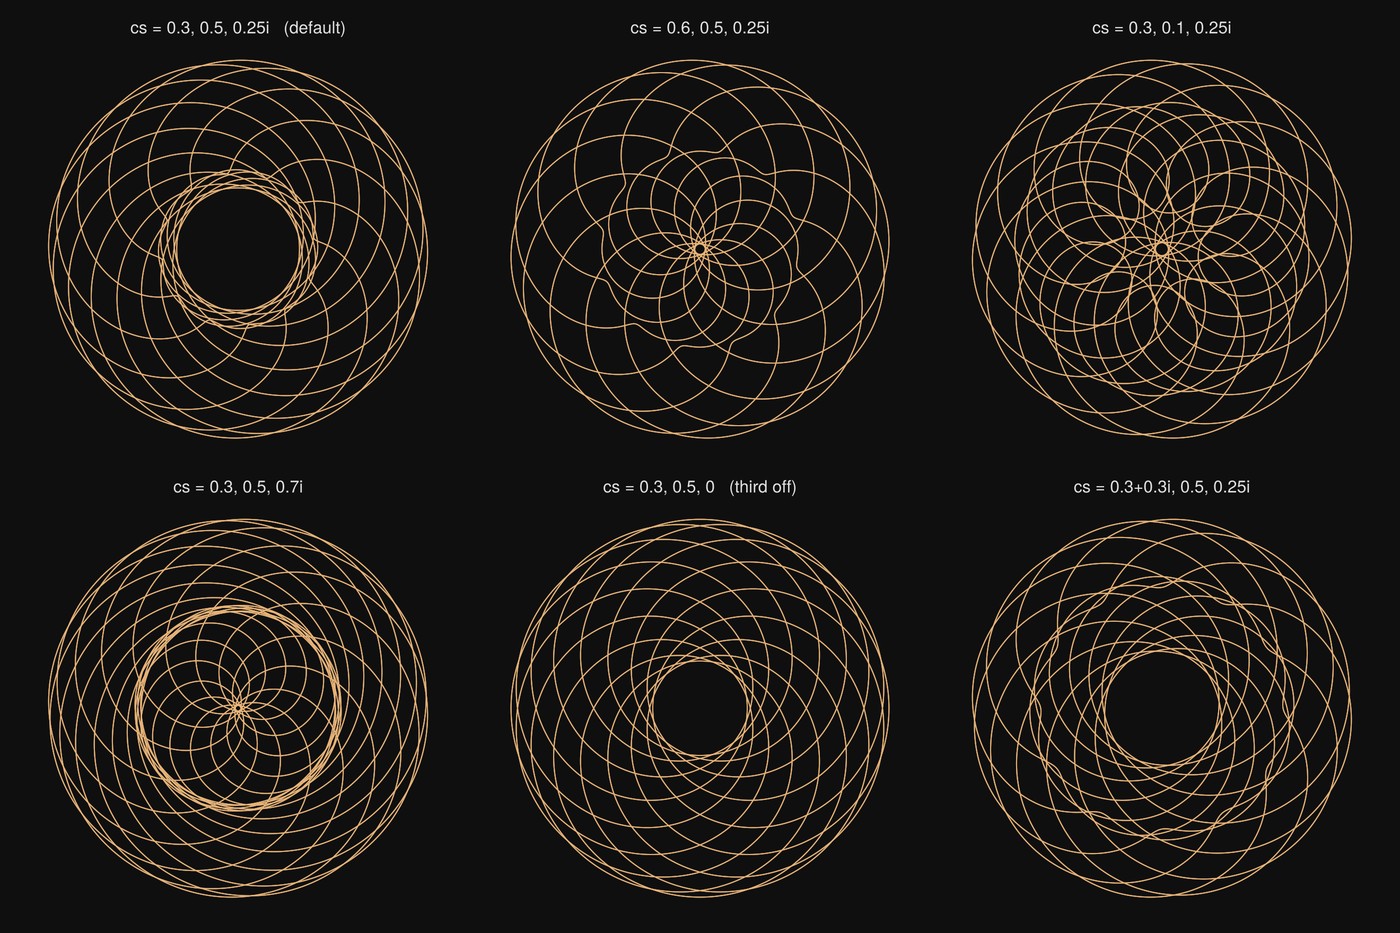
The magnitude of each coefficient is how long that arm is. Growing the first
from 0.3 to 0.6 pushes the curve out until it reaches
the center and the central hole closes. Shrinking the second from
0.5 to 0.1 does the reverse. Setting the third to
0 removes an arm entirely, and the curve becomes visibly simpler.
Coefficients may be complex. 0.3+0.3i instead of
0.3 starts that arm at a different angle, which rotates its
contribution and shifts where the lobes fall without changing their number.
Rotation makes the symmetry
The curve alone is not symmetric. The app draws n copies, each turned by an equal fraction of a full turn:
That is what rotations sets, and it is the only source of the symmetry — the curve contributes shape, the rotation contributes order.
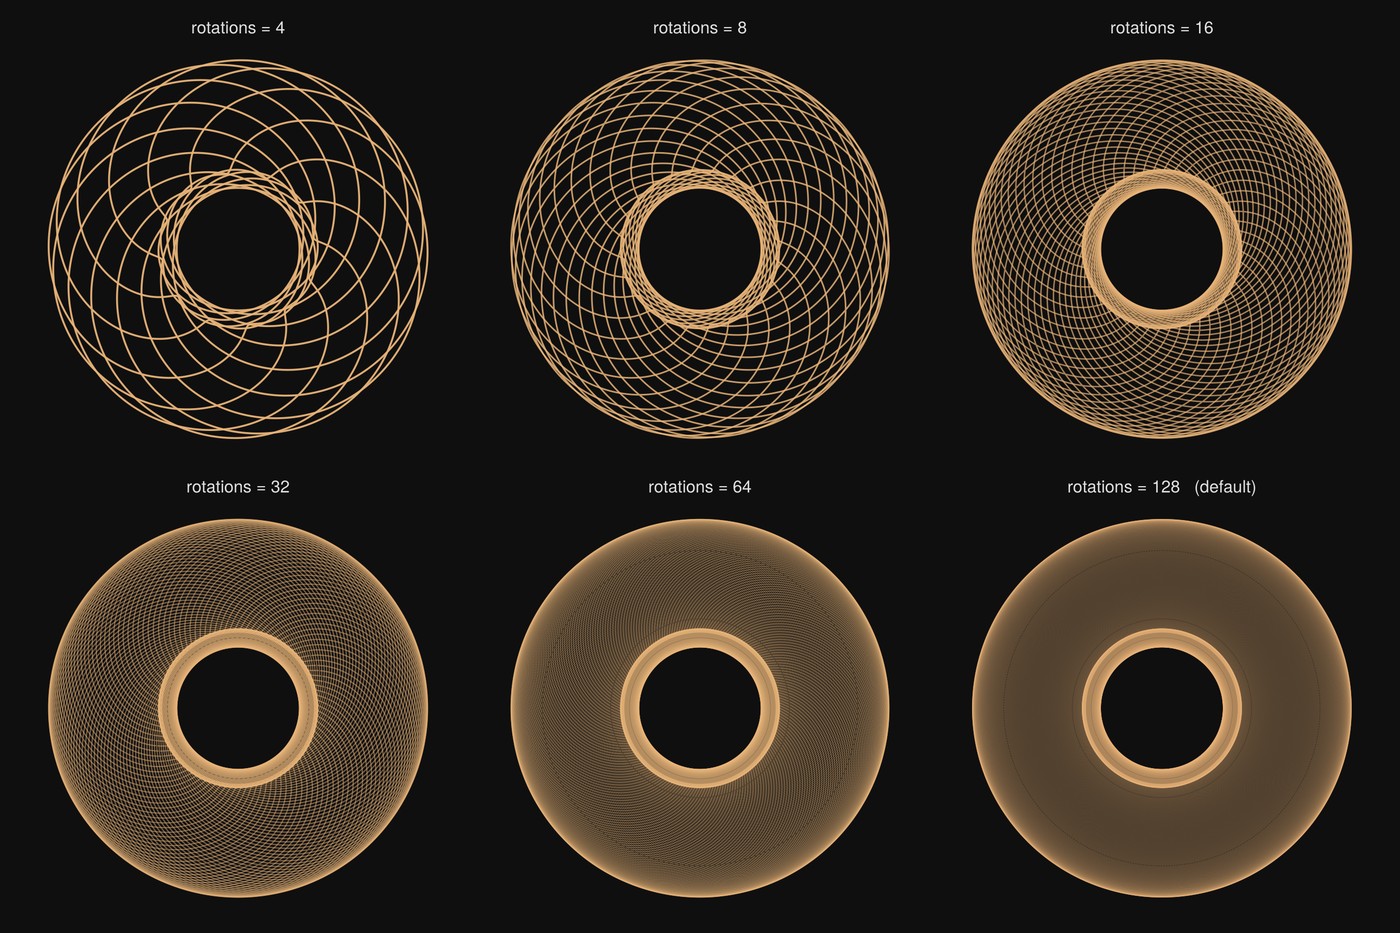
At 4 you can still see the individual curve and how the copies interleave. By 32 they begin to fuse. At 128, the default, they overlap into what reads as a solid form with bright ridges. Those ridges are not drawn — they are where the density of overlapping lines happens to be highest.
Resolution
resolution is how many values of t are sampled
along each curve. Too few and the curve shows as a polygon; past a few thousand
it only costs time.
How the colors are chosen
Color is picked once per rotation, not per point — which is why a finished picture reads as bands rather than a smooth gradient. Each of the n copies is drawn in a single color, and the sequence is produced by a small state machine.
A color scheme is a list of color families, each with a cumulative probability. Before drawing a copy the app draws a random number between 0 and 1 and compares it against those thresholds. Under the first threshold the current color simply drifts — hue, saturation, lightness and alpha each shift by up to ±5%. Otherwise it jumps to whichever family the number lands in, discarding the current color and starting a new run elsewhere in the spectrum.
Try a scheme
Pick one of the four the app ships with, or edit the numbers to design your own. The bars show how often each outcome actually occurs, simulated over 20,000 copies rather than read off the thresholds — the two differ, because of the no-consecutive-jumps rule.
Thresholds are cumulative and must increase to 1.00. Change a number and the bars update.
Paste that into the app: choose Custom… under Color scheme and drop it in the box that appears.
What the families are
Each family is a range, not a fixed color, so no two reds match.
| family | hue | saturation | lightness |
|---|---|---|---|
| red | 351–10° | 0.6–0.8 | 0.3–0.6 |
| orange | 11–40° | 0.7–0.9 | 0.48–0.68 |
| yellow | 41–70° | 0.8–1.0 | 0.48–1.0 |
| yellow-green | 71–100° | 0.8–1.0 | 0.3–0.6 |
| green | 101–160° | 0.8–1.0 | 0.1–0.4 |
| blue-green | 161–200° | 0.8–1.0 | 0.3–0.5 |
| blue | 201–250° | 0.8–1.0 | 0.4–0.6 |
| purple-blue | 251–275° | 0.8–1.0 | 0.4–0.6 |
| purple | 276–315° | 0.6–0.9 | 0.35–0.6 |
| red-purple | 316–350° | 0.6–0.85 | 0.35–0.6 |
| black | solid, opaque | ||
| white | solid, opaque | ||
Alpha is 0.5–1.0 for every randomized family, so the translucency varies as well as the hue — which is what lets overlapping copies build density instead of hiding one another.
The base color
The H/S/L/A fields seed the state machine, and their influence is brief. The base color is never drawn as given — the first copy is already a drifted version of it, and about one time in five the first draw is a jump, which discards it before it is used at all.
After that it fades quickly. On the default scheme a jump arrives after four copies on average, and once it does nothing refers back to the base again. At 128 rotations the base color shapes the first handful of curves and nothing after — so treat it as a starting nudge, not a controlling choice.
Acknowledgment
The construction follows Frank A. Farris, Creating Symmetry: The Artful Mathematics of Wallpaper Patterns (Princeton University Press, 2015).